
“What gets measured gets managed.” This famous management maxim is truer than ever. And yet in today’s data-saturated business world, it comes with a critical caveat: what gets measured wrong gets mismanaged.
Too often, organizations find themselves drowning in “vanity metrics”—numbers that look good on paper but offer no real insight into strategic health or future success. As such, the important thing is not to track more data, but to track the right data.
Our aim with this article is to move beyond the basics of simple measurement to the art of building KPIs (Key Performance Indicators) that actually matter. Specifically, we will explore how to cut through the noise to establish a metrics framework that serves as a meaningful navigation system—one that aligns daily employee actions with your organization’s most critical long-term goals and drives measurable business value.
 |
Author: Jonathan M. Pham |
Highlights
- More than just numbers, KPIs act as a “navigational compass” that bridges the gap between high-level vision and daily operations. Unlike simple metrics that just measure data, a KPI is directly tied to a strategic objective and triggers specific actions when the data changes.
- When it comes to building KPIs, a mix of Leading Indicators (predictive “steering wheels” like sales pipeline value) and Lagging Indicators (output-oriented “rearview mirrors” like annual revenue), as well as a balance between objective Quantitative data and subjective Qualitative insights are required.
- To avoid “vanity metrics” (data that looks good but adds no value), KPIs should be Specific, Measurable, Achievable, Relevant, Time-bound, Evaluated, and Reviewed. Every metric must pass the “So What?” test to ensure it drives meaningful behavior.
- Organizations must guard against the “Cobra Effect,” where narrow targets incentivize harmful behavior (e.g., rushing customer calls to meet time targets). To succeed, leaders should focus on a “critical few” KPIs (5–7 per team) and audit them quarterly to ensure they still align with the company’s evolving goals.
What are KPIs?
Key Performance Indicators (KPIs) are, essentially, quantifiable values that demonstrate how effectively a company is achieving its key business objectives. However, to treat them simply as “numbers to hit” is to miss their strategic value.
A true KPI is a navigational tool. It acts as a compass that indicates whether your organization is on the right path toward its strategic goals. It bridges the gap between your high-level vision (e.g., “Become the market leader“) and day-to-day operations (e.g., “Increase market share by 5% this quarter“).
Metrics vs. KPIs
One of the most common pitfalls in performance management is confusing a simple metric with a KPI. While all KPIs are metrics, not all metrics are KPIs.
- A Metric is simply a measurement of data. It tells you what happened, but not necessarily if it matters.
Example: “Total number of website visitors.” It is an interesting data point, but on its own, it doesn’t tell you if the business is succeeding or not.
- A KPI is a metric that is tied directly to a specific strategic objective. It tells you how well you are performing against a target.
Example: “Conversion rate of qualified leads.” If your strategic goal is to increase sales efficiency, this metric is a KPI. It filters out the noise (random visitors) and focuses on the signal (actual potential revenue), giving actionable insight into your performance.
In essence, if a metric changes and you don’t know what to do about it, it’s just a metric. If a metric changes and it immediately triggers a strategic decision or action, it is a KPI.
The Business Case for Building KPIs
Implementing a robust KPI framework is often viewed as an operational necessity, but the data reveals it is actually a strategic powerhouse. When built correctly, effective KPIs function as a catalyst for engagement, a safeguard for project value, and an engine for organizational agility.
For employees: The clarity engine
More than monitoring tools, KPIs serve as the psychological “bridge” between daily tasks and organizational purpose. High performance begins with clarity, and well-defined KPIs provide the roadmap needed for success.
- The Clarity Factor: According to Gallup research, employees who clearly understand their goals and what is expected of them are 17 times more likely to be engaged in their work. Conversely, a lack of clarity is a primary driver of burnout and turnover.
- The Power of Feedback: Gallup also found that when individuals receive continuous feedback on their targets—rather than just annual reviews—they are 3.6 times more likely to be engaged.
- Performance Gains: Clarity translates directly to the bottom line. McKinsey & Company research indicates that effective, connected performance management systems are crucial for high performance. Specifically, companies that prioritize these strategic metrics are 4.2 times more likely to outperform peers, leading to potential revenue growth of up to 30%.
Read more: How to Build High-performing Teams
For projects: The value guardrail
In project management, KPIs serve as the “navigation system.” Without them, teams may confuse activity with accomplishment, leading to projects that technically “finish” but fail to deliver value.
- Defining True Success: Research by the Project Management Institute (PMI) reveals that nearly 35% of projects that met traditional success criteria (on time/on budget) still failed to deliver the intended business outcomes. This highlights the urgent need for KPIs that measure value, not just activity.
- Financial Impact: McKinsey data indicates that large IT projects run over budget 45% of the time and deliver 56% less value than predicted. That said, companies that actively track and analyze project-based KPIs act as early warning systems and are 46% more likely to exceed their financial targets compared to those relying on intuition or lagging metrics.
For the organization: The agility enabler
For the enterprise as a whole, KPIs are the tools that translate abstract strategy into concrete culture. They enable “Organizational Agility”—the ability to pivot quickly based on data rather than guessing.
- Strategic Execution: A Harvard Business Review study notes that companies with clearly defined and communicated KPIs are 30% more likely to achieve their long-term strategic targets.
- Promoting a Learning Culture: A study cited by Training Industry found that organizations that use KPIs to measure learning and development are 58% more likely to hit their revenue goals. By moving toward fact-based decision-making, businesses reduce operational costs and significantly improve their reaction times to market changes.

Building KPIs
Types of KPIs: Balancing the Scorecard
Effective measurement requires a balanced scorecard that looks at performance through different lenses.
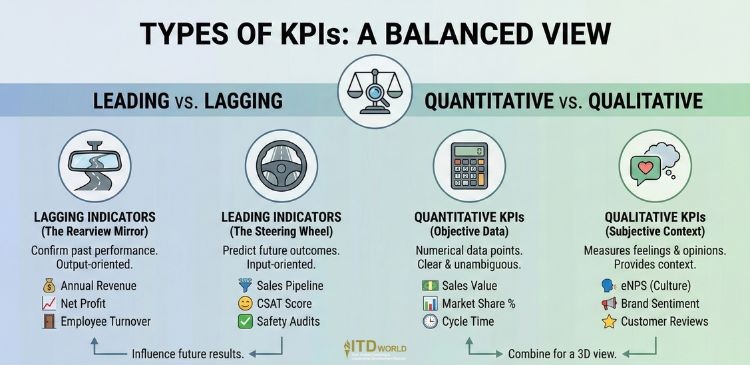
Leading vs. Lagging Indicators
This is arguably the most important concept in strategic measurement.
- Lagging Indicators (The Rearview Mirror): These metrics confirm what has already happened. They are output-oriented and easy to measure, yet difficult to improve once the data is in.
Examples: Annual Revenue, Net Profit, Employee Turnover Rate.
Role: They tell you the score of the game after it has been played. While essential for compliance and reporting success, they offer little opportunity for mid-course correction.
- Leading Indicators (The Steering Wheel): These metrics predict future outcomes. They are input-oriented and typically harder to measure, but they are directly influenceable by the team’s daily actions.
Examples: Sales Pipeline Value, Customer Satisfaction Score (CSAT), Number of Quality Safety Audits.
Role: They tell you if you are likely to win the game. If your “Sales Pipeline Value” (Leading) drops today, your “Revenue” (Lagging) will drop next quarter. Tracking the leading indicator, therefore, allows you to intervene and change the outcome in a timely manner.
High Performance Tip: A healthy KPI dashboard should contain a mix of both – leading indicators for managing daily performance, and lagging for verifying results.
Quantitative vs. Qualitative KPIs
A balanced approach to building KPIs also requires tracking both hard data and soft value.
- Quantitative KPIs: These are objective, numerical data points. They are clear and leave little room for ambiguity.
Examples: Dollar value of sales, percentage of market share, manufacturing cycle time.
- Qualitative KPIs: These measure subjective qualities, often related to feelings, opinions, or properties. While much trickier to measure precisely, they provide context that numbers tend to miss.
Examples: Employee Net Promoter Score (eNPS) to measure culture, Brand Sentiment analysis to measure reputation, or Customer Reviews.
By combining these different types of KPIs, leaders gain a 3D view of their organization—understanding not just how much was achieved (Quantitative/Lagging), but how it was achieved and what is likely to happen next (Qualitative/Leading).
Building KPIs for data driven strategy
What Makes a Good KPI?
As mentioned, many businesses make the mistake of tracking everything that moves. However, a dashboard cluttered with dozens of metrics creates only confusion, not clarity.
To drive high performance, every KPI must earn its place by meeting strict criteria.
The SMARTER Framework
While most leaders are familiar with the SMART goals acronym, high-performance KPI management requires an evolved version: SMARTER – so as to ensure that metrics remain relevant and actionable over time.
- Specific: The KPI must be clear and unambiguous. Everyone should understand exactly what is being tracked.
- Measurable: It must be quantifiable using accurate data sources.
- Achievable: Targets that are seen as impossible demotivate teams rather than inspire them.
- Relevant: The KPI must directly align with a strategic business objective. If the strategy changes, the KPI must be updated accordingly.
- Time-bound: It needs a defined timeframe for measurement (e.g., “Monthly” or “Quarterly”).
- Evaluated: The critical addition. The KPI must be assessed regularly to make sure it is driving the right behavior.
- Reviewed: The targets and the metric itself must be adjusted as the business environment evolves.
The “So What?” Test
Before finalizing a metric, ask: “So what?”
- If this metric goes up, is it definitely good?
- If it goes down, will we take a specific action to fix it?
- If it stays the same, does it matter?
If the answer to any of these is “I’m not sure” or “No,” you are likely looking at a vanity metric.
Example: A marketing team has been tracking “Facebook Likes.” Ask: “So what?” Does a Like generate revenue? Rarely. So it is a vanity metric. A better KPI is “Cost Per Lead,” because if that number spikes, you know you must immediately adjust your ad spend.
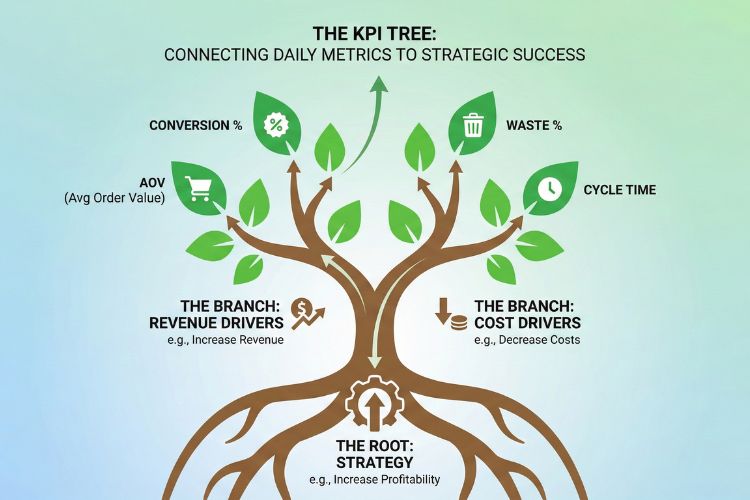
The KPI Tree
A good KPI never stands in isolation; it must be part of a logical hierarchy, often visualized as a KPI Tree.
- The Root: The main strategic goal (e.g., “Increase Profitability”).
- The Branches: The high-level drivers (e.g., “Increase Revenue,” “Decrease Costs”).
- The Leaves: The operational KPIs (e.g., “Average Order Value,” “Raw Material Waste %”).
This mapping ensures that every front-line employee is well aware of how their specific daily metric (the leaf) directly feeds into the organization’s ultimate success (the root).
Building KPIs
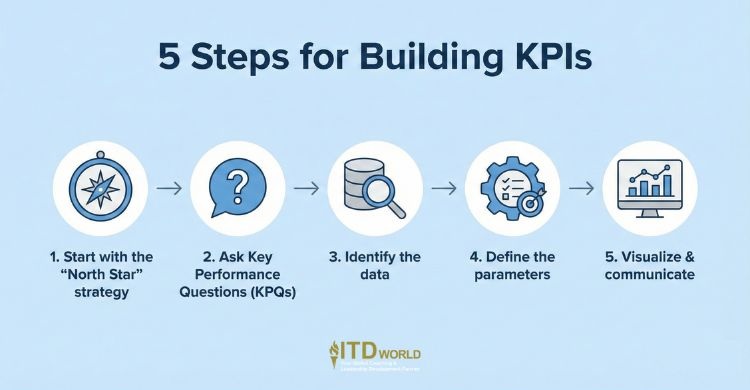
5 Steps for Building KPIs: A Strategic Framework
Building KPIs is a strategic design process. Leaders should avoid the temptation to simply copy metrics from industry templates – and instead follow a structured framework.
-
Start with the “North Star” strategy
A common error is looking at available data (e.g., “We have a lot of data on website traffic“) and deciding to measure it. Instead, clarify your strategic intent first.
Question: “What is the single most important objective we are trying to achieve right now?”
Example: “We need to improve customer loyalty.”
-
Ask Key Performance Questions (KPQs)
Before defining the metric, think about the question you need to answer – so that the resulting KPI may provide actual insight rather than just noise.
Question: “To what extent are our customers recommending us to others?” or “How effectively are we retaining high-value accounts?”
-
Identify the data
Now, and only now, list down the specific data point that best answers your KPQ.
How-to: For the question about recommendations, the best data point is the Net Promoter Score (NPS). For retention, it is the Churn Rate.
Tip: If the data doesn’t exist yet, you may consider establishing a mechanism to capture it (e.g., implementing a post-purchase survey) rather than settling for an imperfect proxy metric.
-
Define the parameters (the “Who, When, and What”)
A KPI is useless without context. To ensure consistency, you must define the operational rules for it.
- Owner: Who is responsible for this number? (e.g., Head of Customer Success).
- Frequency: How often will it be measured? (e.g., Monthly).
- Target: What is the specific goal? (e.g., “Achieve an NPS of +50 by Q4”).
- Thresholds: What are the Red, Amber, and Green zones? (e.g., “Below +30 is Red/Crisis”).
-
Visualize & communicate
Data hidden in a spreadsheet is data ignored. The final step is to determine how they will be reported and visualized.
How-to: Integrate the KPI into a central dashboard (using tools like PowerBI, Tableau, or Excel) accessible to the team.
Note: Do your best to explain to the team why this KPI matters – plus how their daily work influences it. When people see how they contribute to the “North Star,” engagement naturally rises.
How to develop KPIs
Challenges of Building KPIs
Even with a strategic framework, the path to high performance is filled with traps. The psychology of measurement is complex; when you attach a target to a metric, you inevitably change human behavior—sometimes for the worse.
The “Cobra Effect” (unintended consequences)
The most dangerous pitfall in building KPIs is creating one that incentivizes the wrong behavior. This phenomenon, known as the “Cobra Effect,” occurs when employees find a way to hit the target that actually harms the business.
How it looks like: A leader wants to improve efficiency in a customer support center, so they set a KPI for “Average Call Duration” with a strict target of under 3 minutes.
Consequence: To hit the target and secure their bonuses, agents start rushing customers, offering poor quick-fix solutions, or even hanging up on complex calls. The metric improves (calls are shorter), but the actual strategic goal (customer satisfaction) is destroyed.
How to fix it: Never let a quantity metric stand alone. Always pair it with a quality guardrail (e.g., measuring “Call Duration” alongside “First Call Resolution Rate”).
Data overload
The pressure to become “data-driven” is what tempts many business owners to measure everything. However, a dashboard with 50 metrics is not a management tool. When everything is a priority, nothing is a priority.
How it looks like: A marketing team tracks clicks, impressions, likes, shares, comments, reach, and bounce rates across five different platforms.
Consequence: The team spends more time compiling reports than generating insights. They suffer from “analysis paralysis,” unable to identify the critical trends amidst the noise.
How to fix it: Prioritize the “Critical Few.” A good rule of thumb is that a strategic dashboard should have no more than 5-7 top-level KPIs per team.
The “Set and Forget” trap
Strategies evolve, markets shift, and business models pivot—yet often, KPIs remain frozen in time. A metric that was vital two years ago may be irrelevant, or even counter-productive, today.
How it looks like: A startup originally focused on rapid growth tracked “New User Acquisition” as its primary KPI. Three years later, the company has matured and shifted its strategy to profitability, yet the team is still incentivized solely on acquiring new users.
Consequence: The team continues to burn cash on marketing to acquire low-value users to hit the old target, ignoring the new strategic need for retention and monetization.
How to fix it: KPIs must have an expiration date. They should be treated as living tools, audited quarterly to ensure they still align with the current “North Star.”

Building KPIs
KPI Examples by Function: Templates for Success
Below is a curated list of high-impact KPIs, categorized by function.
Note: Notice how the most effective dashboards mix Lagging Indicators (to verify results) with Leading Indicators (to guide future performance), ensuring a balanced view of health.
Sales KPIs
Focus: Revenue Generation & Pipeline Health
| Strategic Objective | KPI | Type | Why It Matters |
| Close Deals | Sales Revenue | Lagging |
The ultimate scorecard. Tells you if the team crossed the finish line.
|
| Future Growth | Sales Pipeline Value | Leading |
Predicts future revenue. If this drops today, revenue drops next quarter.
|
| Efficiency | Sales Cycle Length | Lagging |
Measures the average time from first contact to signed deal. Reducing this accelerates cash flow.
|
| Activity | Discovery Calls Booked | Leading |
A direct input metric. High activity here usually correlates with a healthier pipeline later.
|
Marketing KPIs
Focus: Brand Awareness & Lead Generation
| Strategic Objective | KPI | Type | Why It Matters |
| ROI | Customer Acquisition Cost (CAC) | Lagging |
Measures the cost to win $1 of revenue. Critical for profitability analysis.
|
| Lead Quality | Marketing Qualified Leads (MQLs) | Leading |
Measures the volume of potential customers handed to sales.
|
| Engagement | Click-Through Rate (CTR) | Leading |
Indicates if your message is resonating with the audience before they buy.
|
| Conversion | Lead-to-Customer Ratio | Lagging |
The “truth serum” for lead quality. Tells you if marketing is bringing in the right people.
|
Human Resources (HR) KPIs
Focus: Talent Development, Culture & Productivity
| Strategic Objective | KPI | Type | Why It Matters |
| Culture Health | Employee Net Promoter Score (eNPS) | Leading |
The “canary in the coal mine” for culture. Predicts turnover before people actually quit.
|
| Retention | Turnover Rate | Lagging |
Measures how many people have left. High turnover indicates deeper cultural or management issues.
|
| Recruiting | Time to Hire | Lagging |
Measures efficiency. Long hiring cycles cost money and lose top talent to competitors.
|
| Development | Training Completion Rate | Leading |
Indicates the organization’s commitment to upskilling and future readiness.
|
Finance KPIs
Focus: Financial Health & Sustainability
| Strategic Objective | KPI | Type | Why It Matters |
| Profitability | Gross Profit Margin | Lagging |
Indicates how efficiently the core business produces its product/service.
|
| Liquidity | Operating Cash Flow | Leading |
Cash is oxygen. This predicts if the business can pay its bills in the near future.
|
| Growth | Monthly Recurring Revenue (MRR) | Lagging |
The “holy grail” for subscription models; measures stable, predictable growth.
|
| Discipline | Budget Variance | Lagging |
Measures execution against the plan. Helps identify areas of overspending early.
|
Customer Success KPIs
Focus: Loyalty & Satisfaction
| Strategic Objective | KPI | Type | Why It Matters |
| Loyalty | Net Promoter Score (NPS) | Leading |
Measures willingness to recommend. High NPS correlates strongly with organic growth.
|
| Retention | Churn Rate | Lagging |
The percentage of customers lost. In many models, reducing churn is more profitable than acquiring new customers.
|
| Responsiveness | First Response Time | Leading |
Speed matters. Faster responses directly influence customer satisfaction scores.
|
Key performance indicators examples
From Measurement to Management: Keeping KPIs Alive
To drive high performance, leaders must shift their mindset from measurement (gathering data) to management (using data to make decisions). A KPI is only as valuable as the conversation it triggers.
Establish a review rhythm
Data has a shelf life. Looking at last month’s leading indicators today is too late to influence the outcome. High-performing organizations, therefore, establish a disciplined cadence of review meetings, ensuring that data drives action in real-time.
- Weekly Huddles (Operational Focus): Focus primarily on Leading Indicators.
Question: “Based on this week’s activity (e.g., calls made, support tickets closed), are we on track to hit the month’s goal? If not, what do we change tomorrow?”
- Monthly Reviews (Strategic Focus): Review a mix of Leading and Lagging Indicators.
Question: “Did our activities last month result in the outcomes we expected? Are our hypotheses holding true?”
- Quarterly Deep Dives (Strategic Alignment): Focus on Lagging Indicators and high-level trends.
Question: “Is our overall strategy working? Do we need to pivot our approach or adjust our targets for the next quarter?”
Moving from blame to solutions
How a leader reacts to a “Red” (missed) KPI defines the culture of the team. If a missed target is met with anger or blame, employees will learn to hide bad news or manipulate the data (“sandbagging”) to ensure the dashboard always looks “Green.”
Mindset: In a culture of integrity, a “Red” KPI is not treated as a crime, but a signal of a problem – which the team is invited to fix.
How-to: When a target is missed, the conversation should not be “Whose fault is this?” but “What is the root cause, and what is the specific ‘Path to Green’?” This shifts the energy from defense to collaborative problem-solving.
KPIs are living tools
Strategies change, and so must your metrics. If a KPI has been “Green” for six consecutive months, it may no longer be driving performance. In fact, it might mean the target is too easy – or that the process is now stable enough that it no longer requires executive focus.
How-to: Leaders should audit their KPI dashboard every quarter. Don’t be afraid to kill a metric. If a team member can’t explain why they are tracking a specific number or what decision it drives, remove it. A leaner dashboard often leads to faster execution.

Building KPIs
Beyond Building KPIs: Creating a High-Performance Culture with ITD World
KPIs are merely the dashboard; your people are the real drivers. Even the most sophisticated metrics will fail if your leaders lack the skills to set clear expectations, provide meaningful feedback, or facilitate the difficult conversations that turn data into action.
At ITD World, we understand that high performance is not achieved through software alone, but through the development of capable, agile, and data-literate leaders. As such, we partner with organizations to bridge the gap between high-level strategy and ground-level execution.
Our targeted solutions are designed to support every stage of the organizational transformation process:
- Strategic Planning & KPI Workshops: High-impact sessions for leadership teams to define their “North Star,” map strategic drivers, and design a cohesive KPI framework that aligns the entire organization.
- Performance Management Training: Programs that teach leaders how to set SMART targets, conduct effective performance reviews, and provide high-quality input.
- Leadership Coaching: Our one-on-one coaching solution empowers leaders to overcome “analysis paralysis,” interpreting data with confidence to make faster, more impactful strategic decisions.
Ready to move beyond vanity metrics and build a culture of true accountability and results? Contact ITD World today to learn how our training and coaching solutions can help you define, measure, and achieve your high-performance goals!
Other resources you might be interested in:
- Leadership Journey: How to Grow as a Leader at Every Stage
- Senior Leadership Playbook: Bridging Strategy & Execution
- 5 Executive Coaching Goals Leaders Need for Success
- Leading With Impact: Translating Your Presence Into Performance
- Business Process Transformation: Strategies for Success