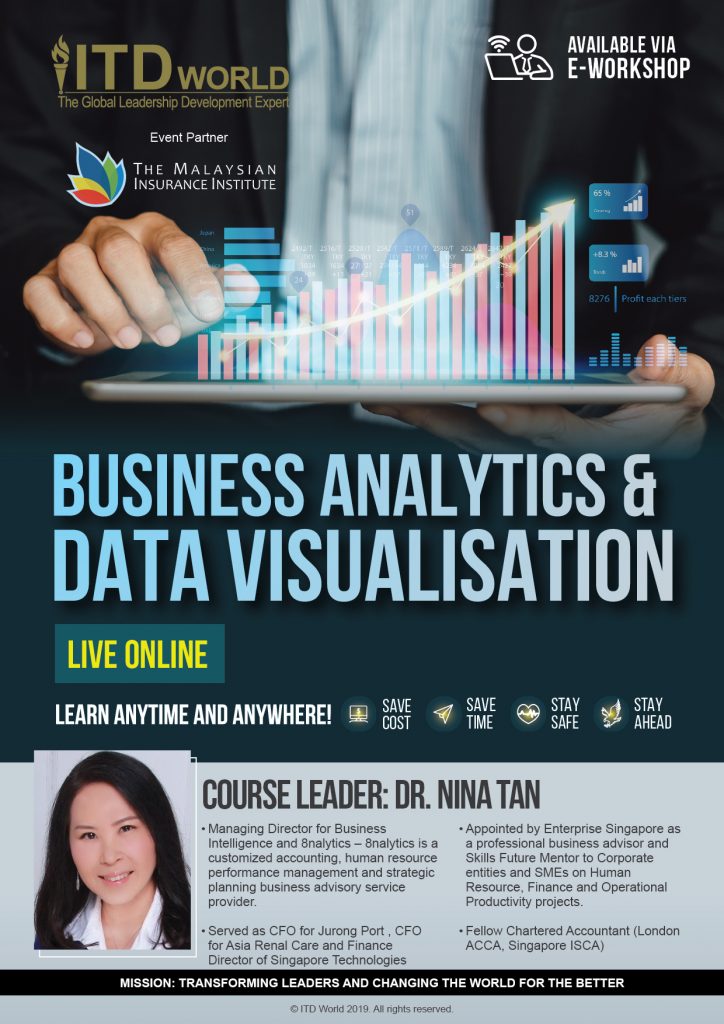
Business Analytics and Data Visualisation

Brochure
Fee and Registration
According to the latest Bloomberg survey, business analytics has been effective in decision making for 3 out of 4 enterprises. Some of the benefits of applying business analytics are increased profitability, reduced costs, quicker decision-making, and other critical performance improvements. This 2-day program aims to provide you with an understanding of how the scientific use of data analysis and data visualisation can lead to improved decision making and problem solving. It is an introductory course to probabilistic and statistical concepts. By the end of this course, you will be equipped with relevant skills to make sense of your data, present clear evidence of your findings, and tell engaging stories all through data visualisation. Through a combination of seminar and case studies, you will also be equipped with the knowledge on data preparation and cleansing, effective data storytelling through visual analytics and experience hands-on practice of the visualisation tool, Tableau. This course includes an assessment element.


